A debugger is a powerful tool that enables you to run your test step by step. It’s a very essential skill and every automation tester must be acquainted with it. Using the debugger tool you can easily figure out where the issue lies in the code. You can also use the debugger tool at the time of the script development to check whether a piece of code is working fine especially when you are doing any mathematical calculation or you have to check whether the expected value is being returned from a function etc. In this article, I will explain in detail to understand how to debug a test in UFT.
The Process to Debug a Test in UFT
Prerequisites of Debugger Tool
If you are using UFT 12.02 or prior versions make sure Microsoft Script debugger is installed on your machine otherwise debugger tool in UFT/QTP won’t work. You can go to Control Panel and check whether it is installed.
Benefits of Using the Debugger Tool
- You can watch the runtime values of variables
- You can write your own expression at runtime check its output
- Manipulating the values of variables at runtime
Different Ways to Debug a Test
- Adding a Breakpoint
- Running a Test by Pressing F11 or by selecting the Run>Step into the option.

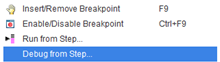
- Debug From Step by doing right-click at any step and select this
Adding BreakPoint
Inserting a breakpoint will stop the execution of the Test at the particular line and let you allow to execute each line step by step to figure out where is the issue in the script. You can add a breakpoint in the following ways.
- Press F9 at the line
- Go to “Run>Insert/Remove Breakpoint”
- Do a left click at the line on the vertical bar just before the line number shown in the UFT Editor where you want to insert the breakpoint.
- Do a left click in the left gray margin next to the line of code as shown below.

Removing breakpoint
- Press Ctrl+F9 at the line where there is a breakpoint
- Go to “Run>Insert/Remove Breakpoint”
- Again do a left click on the vertical bar just before line number where there is a breakpoint.
Debugging Methods
- Step Into: Used to execute each and every step. Mostly used to steps into a Function/Action and executes line by line. It automatically pauses on each line after execution.
- Step Over: Used to step over the step or function. The ‘Step Over‘ runs only the current step in the active document that means if you step over a function in your test, the whole function will be executed in one go and the script will pause at the next step of the function.
- Step Out: After step into the function, you can use the Step Out option at any point to come out from the function. The run session is paused at the next line.
Working with Breakpoints
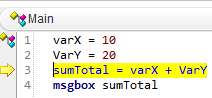
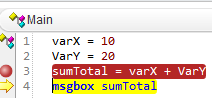
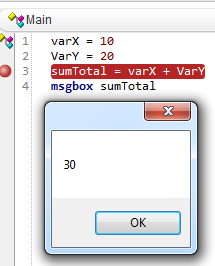
Write the following Code in the UFT Editor and add a breakpoint at the third line and run your Test.
|
1 2 3 4 |
varX = 10 VarY = 20 sumTotal = varX + VarY msgbox sumTotal |
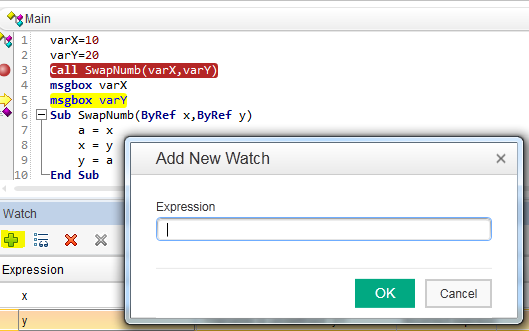
Add To Watch
|
1 2 3 4 5 6 7 8 9 10 11 12 13 |
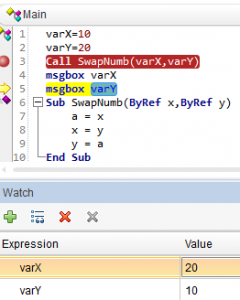
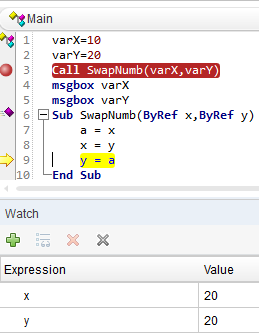
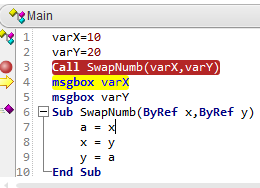
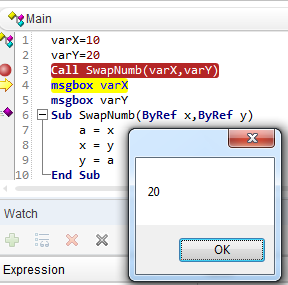
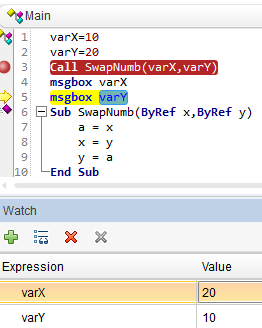
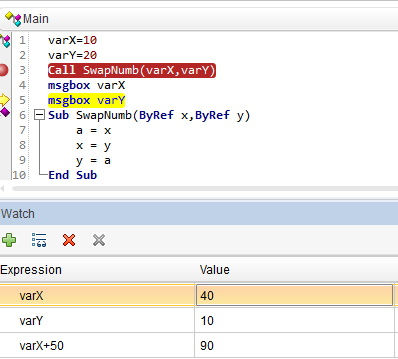
varX=10 varY=20 Call SwapNumb(varX,varY) msgbox varX msgbox varY Sub SwapNumb(ByRef x,ByRef y) a = x x = y y = a End Sub |
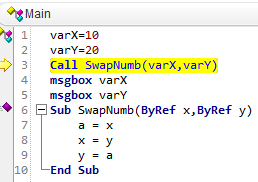
Add the breakpoint at line number 3 and run the Test.

The execution will be paused in line 3.
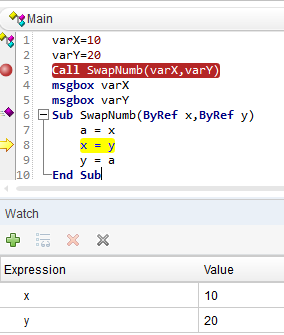
Press F11 to Step Into the function. The execution arrow will jump to line 7 to gon inside the function.
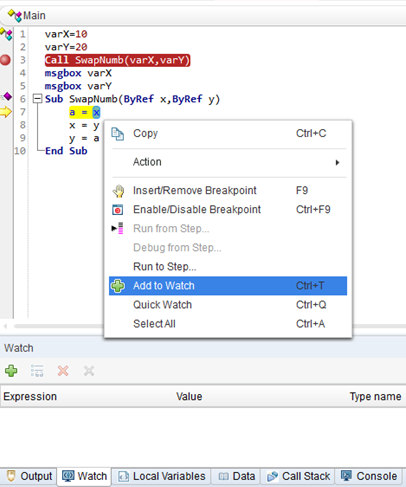

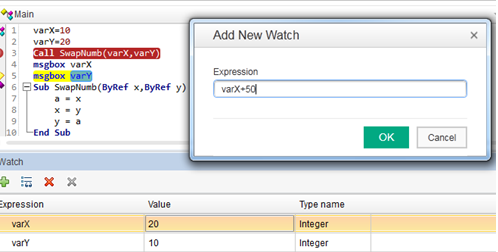
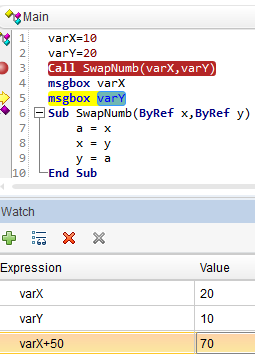
Add Expression
Updating the Value of a variable at Runtime
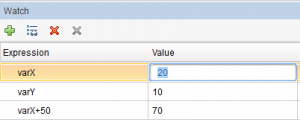
*Note: If you are updating the value of a string variable, the value must be within double-quotes.
Recommended Posts
- Import Excel File into Datatable in UFT
- Capture Screenshots in UFT and Save them in Word Doc
- Mainframe Automation Using UFT One
- Component Object Model in UFT | DOM | TOM & BOM
- How to Use LoadAndRunAction in UFT
- How to Use WaitProperty | Dynamic Wait in UFT
- Text Checkpoint and Text Area Checkpoint in UFT
- How to Use Test Combinations Generator in UFT
- 20 Useful VBA Date Functions in UFT You Must Know