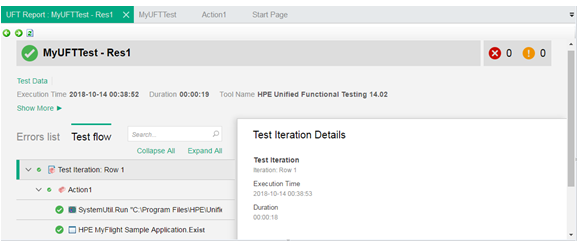
With the introduction of UFT14.02, Micro Focus has introduced a new HTML format report along with “Run Results Viewer Report”.This new format UFT report is the default report for the test results. If you run a Test in UFT, the run result would be shown in a new slick format as shown below. Click on the “Test flow” to see the details of the run result.

You can search for any reported step by typing the keywords in the search box. To see all reported steps move the mouse cursor to the Test Flow section and the vertical scrollbar will be displayed.

To know more details about the Test Click on the “Show More” link.UFT will show further details like the duration of execution, Tool Name, and other details.
You can see the runtime Datatable by clicking on the “Test Data” link.
To switch back to the Result Viewer report, select Tools>Options>General>Run Sessions and select the Run Result Viewer Report option.

Now run your Test and UFT will generate the report in Result Viewer format rather than HTML format.

Expand and Collapse Feature
By default, the nodes of the result viewer are shown in the collapsed view. You can manually expand the nodes one by one or you can use the menu option to ‘Expand All‘ to expand all the nodes in one go and also minimize it up to your choice.
Applying Filters in Result Viewer
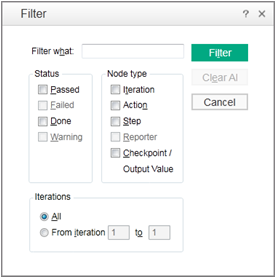
In the Result Viewer format report, you have the option to filter out events based on statuses. Click on the filter icon, a small window would be displayed with checkboxes for every status(Passed, Failed, Warning, and Done). You can also apply filters based on Node type(Iteration, Action, Step, Reporter, Checkpoint / Output Value). Select the required checkboxes and click the OK button. The report viewer would apply the filters and display only selected statuses.
The following is a sample example of applying a filter on Pass statuses only.
If you are having multiple rows in the UFT Datatable and executing a Test in the iteration for each row a comprehensive report would be generated. For instance, if you are running a Test for ten iterations and a couple of steps are is failing inside 5 iterations. You want to analyze the issue in this situation, you can put a filter on the Failed status and set the iteration from 1 to 5 as shown in the following snapshot.
You can also clear filters by clicking on the “Clear All”button.
View the Runtime DataTable
If you are loading data into runtime DataTable or adding data into DataTable during the Test execution, the same would be not available into DataTable when the execution is over. If you want to see what were the values in the runtime DataTable, you can see that in the Report Viewer. Select the Data tab in the result viewer and the runtime Data would be shown.
Establish Connection to HP ALM & Raise a Defect
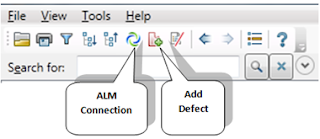
You can also connect to HP ALM through result viewer and raise a defect into ALM.
Click on the ALM Connection to establish a connection with HP ALM. You have to provide the URL of the AML server and enter your credentials and click on the “Connect” button. After successful authentication, the list of Domain and Projects you have the privilege of would be available in the form of the list box. Select the required Domain and Projects and click on the “Login” button. Now you can access the defect module and raise a defect.
Recommended Posts


